
What happens to markets around election time?
Markets · Midterms 2026
Every midterm, somebody’s brother-in-law goes to cash. We pulled daily S&P 500 data back to 1950 and lined it up against all 19 midterm elections.
The Question
The question we get every October
Every two years, right about now, the attack ads start interrupting the Broncos game and somebody’s brother-in-law announces at dinner that he’s “going to cash until this blows over.” Then the same question lands on our desk: “Should I do something with my portfolio before the election?”
It’s a fair question. The yard signs are multiplying faster than the prairie dogs, and every cable channel has a panel of people who are certain the republic ends on November 4 if the other side wins. And when you’re living off your savings instead of a paycheck, “wait and see” feels a lot riskier than it did at 45.
So we did what we do around here: we pulled the numbers ourselves. We took daily S&P 500 closing prices back to 1950, lined them up against all 19 midterm elections since then, and asked three questions. What does the market actually do around a midterm? What happens when the president’s party gets shellacked? And what could realistically change for retirees after November 3?
Short version: the market has been remarkably indifferent to which party wins Congress. The thing most likely to hurt your retirement isn’t the election result. It’s what you do about it.
The Numbers
What the market actually does around a midterm
Here’s the first thing we found, and it’s the one that should let you sleep in October. Three months after a midterm, the S&P 500 was above its Election Day close in 17 of the 19 elections since 1950, with an average gain of 7.5% over those 63 trading days. The two exceptions were 2002, when a bear market that had nothing to do with Congress was still grinding on, and 2018, when a December sell-off over interest rates did the damage, not the new House majority.
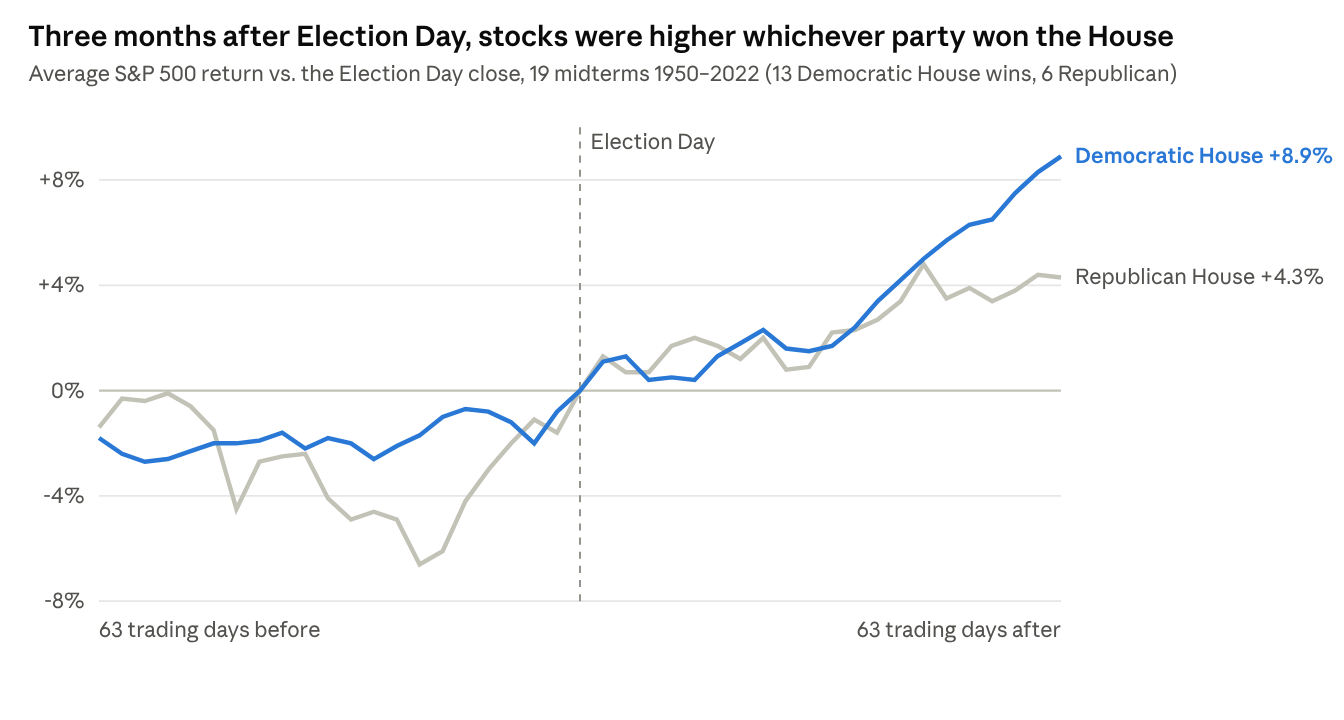
Split it by which party won the House and the picture barely changes. When Democrats won, stocks averaged +8.9% over the following three months. When Republicans won, +4.3%. Both positive, both well inside the normal wobble of any three-month stretch, and six Republican-House elections is a small enough sample that we wouldn’t bet the ranch on the gap.
The more interesting part is the run-up. In years Republicans took or held the House, the market tended to sag through September and October, bottoming about a month before the vote, then turning up into Election Day. In Democratic-House years the pre-election dip was shallower. Either way the shape is the same: uncertainty gets priced in before the vote and comes back out after it, regardless of who wins. Markets dislike a question mark more than they dislike either party.
The Shellacking
When the president’s party gets shellacked
Now the scarier scenario, at least if you’re the one living in the White House. The president’s party has lost control of at least one chamber in 8 of the 19 midterms since 1950: 1954, 1986, 1994, 2006, 2010, 2014, 2018 and 2022. If you believe the panels on cable news, each of those should have been a catastrophe for stocks.
Twelve months later, the S&P 500 was higher after every one of them. The average gain was 12.8%, versus 15.1% across all 19 midterms and 16.8% in the years the president’s party held on. So yes, gridlock has been a touch less lucrative than unified government, on average. But “a touch less than great” is not the same as “bad.” The weakest of the bunch was 1986 at +1.1%, and that’s only because Black Monday landed in October 1987, which had nothing to do with Reagan losing the Senate.
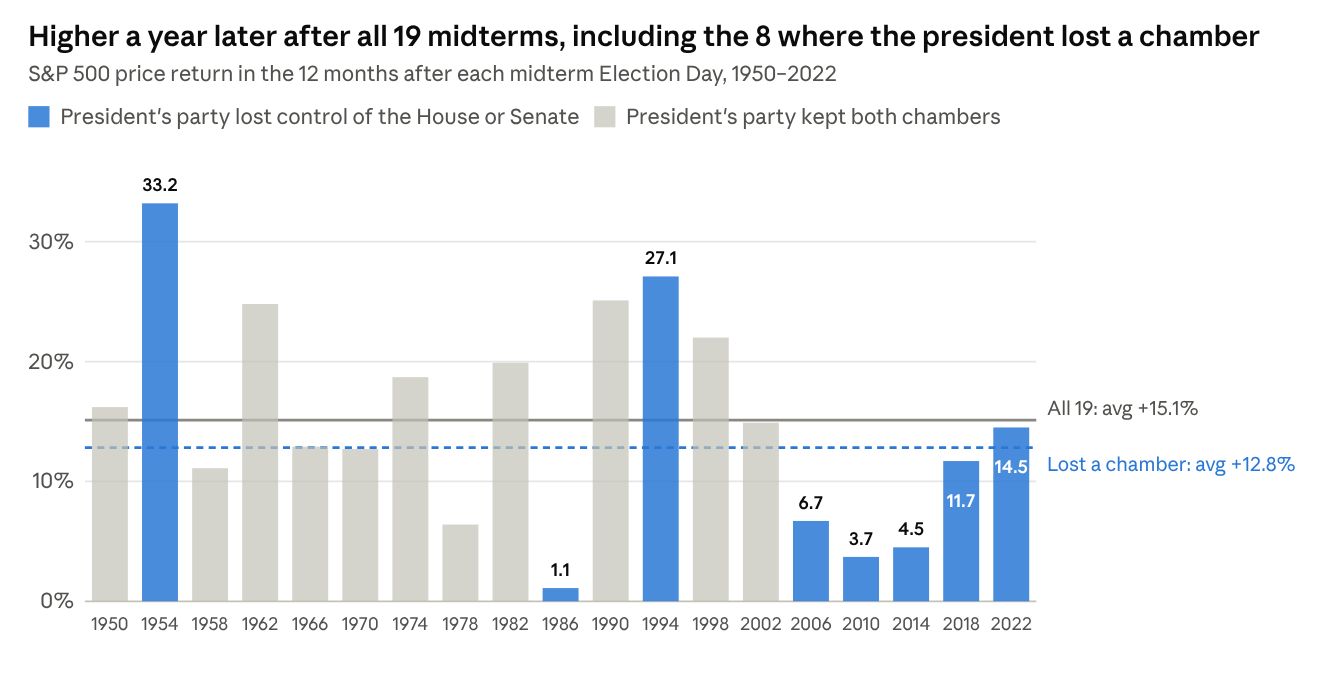
In fact, the 12 months after a midterm have been positive in all 19 cases. We’re not going to tell you that’s a law of physics. It’s 19 data points, the economy matters far more than the seating chart in Congress, and the next one could break the streak. But if you’re tempted to sell because the “wrong” party might win, you’re betting against a 19-for-19 record to avoid a risk that history says isn’t there.
One more number we found while we were in the data, because it’s the one that matters most for anyone drawing income from a portfolio: the S&P 500’s low point during a midterm year has been followed by an average gain of 32% over the next 12 months, and never less than 12.6%. Midterm years are famously choppy. The chop is what you sit through to get the rally. This year’s low so far was March 30, and by late September the index was already up about 22% from it.
After November 3
What could actually change after November 3
History is a comfort, but every election is its own animal, so here’s the lay of the land. Republicans go into this one holding the House by a handful of seats and the Senate 53 to 47. All 435 House seats and 35 Senate seats are on the ballot. Democrats need a net gain of three or four House seats to take the gavel and four Senate seats to flip that chamber. Flip either one and you get divided government for the last two years of the Trump administration.
Divided government is the scenario investors tend to ask about most, and it’s also the most boring one. Fewer big bills get passed, more gets done by executive order, and the headlines get louder while the actual rulebook changes less. For retirees, the important part is what’s already locked in. The 2025 tax law made the 2017 income tax brackets and the larger standard deduction permanent, so there’s no tax cliff waiting at the end of this year regardless of who wins. What isn’t permanent is worth watching: the extra $6,000 deduction for taxpayers 65 and older runs only through the 2028 tax year and phases out above $75,000 of income for singles and $150,000 for couples, and the $40,000 cap on state and local tax deductions snaps back to $10,000 in 2030. Whether those get extended is a question for the next Congress, which is to say it’s a question for this election and the one after it.
The bigger retiree issue isn’t on any ballot, but it’s coming either way. The Social Security trustees’ June report moved the retirement trust fund’s depletion date up to late 2032. If Congress does nothing, benefits get cut automatically by roughly a fifth at that point. Neither party is campaigning on a fix, which tells you it will land on the desk of whoever wins the next two or three elections. We plan around it with every client, and the right way to plan around it has nothing to do with your party registration.
Then there’s the one issue that has somehow refused to be partisan: AI and the data centers that power it. The House passed a bill in September making large power users pay for the grid upgrades they require by a vote of 417 to 3. The Senate version got 57 votes on September 30, short of the 60 it needed, and the fight was over whether the rule should be mandatory or optional, not whether it should exist. Meanwhile, according to GatherGov’s tally, 270 local governments adopted data-center moratoriums so far in 2026, led by California, Georgia, Florida, New Jersey and North Carolina, which is about as bipartisan a list of states as you can assemble. A Marist poll in mid-September found 65% of voters oppose a data center in their own community.
Why does that matter to your IRA? Because AI capital spending is doing more to drive earnings growth in the S&P 500 right now than anything Congress is debating. Policy that slows the buildout or raises its cost would ripple through every index fund, and it would do so whichever party holds the gavel. If we’re watching one policy thread between now and next year, it’s that one, not the seating chart.
Your Move
What this means for your retirement plan
So what do you actually do with all this? Mostly, the same things we’d tell you in a year with no election at all, which is sort of the point.
Start with a simple test. If your retirement plan only works when a particular party wins, you don’t have an election problem, you have a plan problem. A plan built for a 30-year retirement is going to live through seven or eight Congresses and several presidents you’ll like and several you won’t. It has to work under all of them, or it doesn’t work.
Second, make sure the money you’ll spend over the next few years isn’t riding in the part of the portfolio that can drop 8% in a month. That’s what an income floor is for: Social Security, a pension if you have one, cash reserves, and for some people a guaranteed income source like an annuity. When the next three to five years of spending are already spoken for, a choppy October is something you read about rather than something you feel. The clients who came through 2022 calmly were the ones who had this in place.
Third, plan around the rules that exist, not the ones being argued about. The brackets are permanent, the senior deduction window is 2025 through 2028, and required minimum distributions don’t care who the Speaker is. Roth conversions, charitable giving from an IRA, and the timing of withdrawals are all decisions you can make right now with known numbers. Those decisions will do far more for your after-tax income than correctly guessing the Senate.
Fourth, rebalance on a schedule, not on a headline. If the market runs after the election, trim and move the gains into your floor. If it doesn’t, you’ve already got the floor. Either way you never have to be right about politics.
And finally, go vote. Then go for a hike. Cast your ballot and keep your allocation.
If you’d like to see how your own plan holds up under a bad year, a flat year, or a Congress you can’t stand, we’ll run it with you. Come by the office or set up a phone or video call, and we’ll put your numbers on the screen instead of the pundits’ opinions.
How we ran the numbers, and the fine print
Market figures are New Light Financial’s own calculations from daily S&P 500 closing prices (Yahoo Finance ^GSPC history, taken from two public GitHub datasets covering 1927–2019 and 1980–September 25, 2026, which agree to the penny where they overlap). Midterm Election Day is the first Tuesday after the first Monday in November; the reference close is that day’s close, or the prior close in years the market was shut. “Three months” is 63 trading days; “12 months” is Election Day to the last close on or before the same date a year later. All returns are price only, with dividends excluded, so total returns would be modestly higher. House control and whether the president’s party lost a chamber are from the official results of each election.
Policy sources: GatherGov’s data-center moratorium tally, reported September 16, 2026; PBS News/NPR/Marist poll, September 14–15, 2026; Senate vote on the data-center grid-cost bill, September 30, 2026; 2026 Social Security Trustees Report summary; AARP summary of the 2025 tax law; balance of power heading into 2026.
Let’s talk through how the pieces fit together for you
Schedule a phone or video call, or come by the office, and we’ll walk through how this fits your own plan — no pressure, no homework required.
New Light Financial LLC is a Colorado state-registered investment adviser. Insurance products are offered through New Light Services LLC, a Colorado-licensed insurance agency under common ownership. This post is for general education and is not personalized investment, tax or legal advice; talk with us or your tax professional about your own situation before acting on anything here. Past performance does not guarantee future results, and nineteen elections is a small sample. The S&P 500 is an unmanaged index of large U.S. companies; you cannot invest directly in an index, and index figures do not reflect fees. All investing involves risk, including the possible loss of principal. Annuity guarantees are backed solely by the claims-paying ability of the issuing insurance company.